
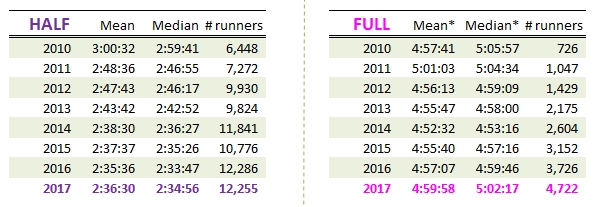
![*Net Finish Times winsorized at 6:15 [click to enlarge]](https://purutheguru.me/wp-content/uploads/2017/01/screenshot302.jpg)
I wrote a quick update on the numbers of 2016 a year ago, and this short conversation is to mirror that with an update for the 2017 race event of 15th January.
The total number of participants in the Standard Chartered Mumbai Marathon went up again this year but only marginally (by less than 1000). Of that, in the half marathon, the numbers were capped (presumably for safety reasons) and the full marathon saw another year of increasing participation.
The overall (mean and median) race times of those who crossed the finish line was slower for the half marathon. (I might provide further insight regarding that in the weeks ahead.) For the full marathon, the worsening we have seen in the last two years, became worse (slower) this year. It is not unlikely that the increased worsening in finish times is driven by the large number of new entrants, but given that the number of entries has been increasing every single year, to blame the newbies for the recent worsening is unjustifiably unfair without delving into the details.
To get a better picture of what has been happening with aggregate numbers, you can also see my much earlier report on what happened between 2010-2014. And for the most sophisticated analysis on Indian marathon running so far you may want to look at the question “Are Recreational Marathoners in India getting Faster?” and its follow-on multi-year cohort analysis in “You are getting slower sooner than you think“.
Please click on ONE choice for YOUR answer here
If you had not already thought about it when looking at the graphs and tables in this article, then from the two earlier articles on consecutive races, and multi-year cohort analysis, you would have figured out that interesting stories are hidden in the details of aggregated statistics. I might tease out more such stories for you in the weeks to come. Until then, here are the tables for the graphs above.

Dr Purnendu Nath spends his waking hours focusing on helping individuals and organizations reach their goals, to make the world a better place. He speaks, writes and advises on topics such as finance, investment management, discipline, education, self-improvement, exercise, nutrition, health and fitness, leadership and parenting.

Hi Puru, as a more meaningful benchmark of quality standards, I’d like to see a yearly table/chart of the total number of runners who have completed the full marathon in sub 4 hours. The number of SCMM FM registrants isn’t saturated (unlike the HM) so while the big increase in entrants will give slower mean and median times, the absolute numbers of sub-4 runners will give a measure of the level of improvement (or otherwise). Do you have these data to hand? It would also be interesting to see the total yearly numbers of sub 2 hour HM finishers. These cutoff times are of course arbitrary, but give an indication of runners who have trained in a focused way.
LikeLike
Dear Philip
Lovely to see you commenting on my article again…
I have all the data I need to answer most questions… However, I am not so interested in sub-4 or sub-2 runners as they make up barely the top 10% of all runners. There’s no reason to suggest that slower runners are not training well. In fact, one might argue, that the faster runners are complacent and focus less on quality training because their DNA already gives them a relative advantage vis-a-vis others. [I have enough mentoring related evidence to suggest this might well be the case!]
Having said that, I will look into your question about that specific sub-4/sub-2 group and get back to you. Publishing the results might be of little value to the larger aim of improving public health overall. Perhaps breaking down the numbers of “You might be getting slower sooner than you think” into net-time bands will be a more revealing exercise.
Hope you are enjoying the winter! I’ll be in London again very soon 🙂
Cheers!
Puru
LikeLike
Thanks Puru – hope to see you running in the cold of England sometime soon. I am interested to see the sub-2 stats.
Just to come back on one thing – you say “sub-2 runners…make up barely the top 10% of all runners” – I don’t think this is broadly applicable (certainly not outside India). If you look at the most recent results for my small home-town Half Marathon (in Cambridge UK), which is fairly unexceptional, there were around 5300 finishers. There’s no prize-money and the event doesn’t attract “professional” runners (nobody at national or international level): it’s just a generic community Half Marathon. The overall median finishing time (men + women) was 1:58:12. The median time for the 2962 male finishers was 1:50:37, and for the 2362 women finishers the median time was 2:08:10. Clearly there isn’t the punishing humidity and heat of Mumbai, and the course is a little flatter, but it’s far from the case that good DNA is needed for a sub-2 finish. The DNA of an average runner is just fine… 🙂
LikeLiked by 1 person
Ah, but Philip… you need to look at THIS specific population… the 2-hour mark …in England it defines the median… In India it defines a left tail outlier!! And, surely, that’s why you suggested I examine that subset in the first place?
LikeLike
Dear Puru Sir just finished reading urban latest review on Scmm 17. Really amazing how you can summarize such innovative inputs on running issue. Hat’s off sir. Regards
LikeLike
[…] wrote a quick update a year ago on the numbers of 2017, and before that, on the numbers of 2016, and this short conversation is to provide you with an […]
LikeLike