
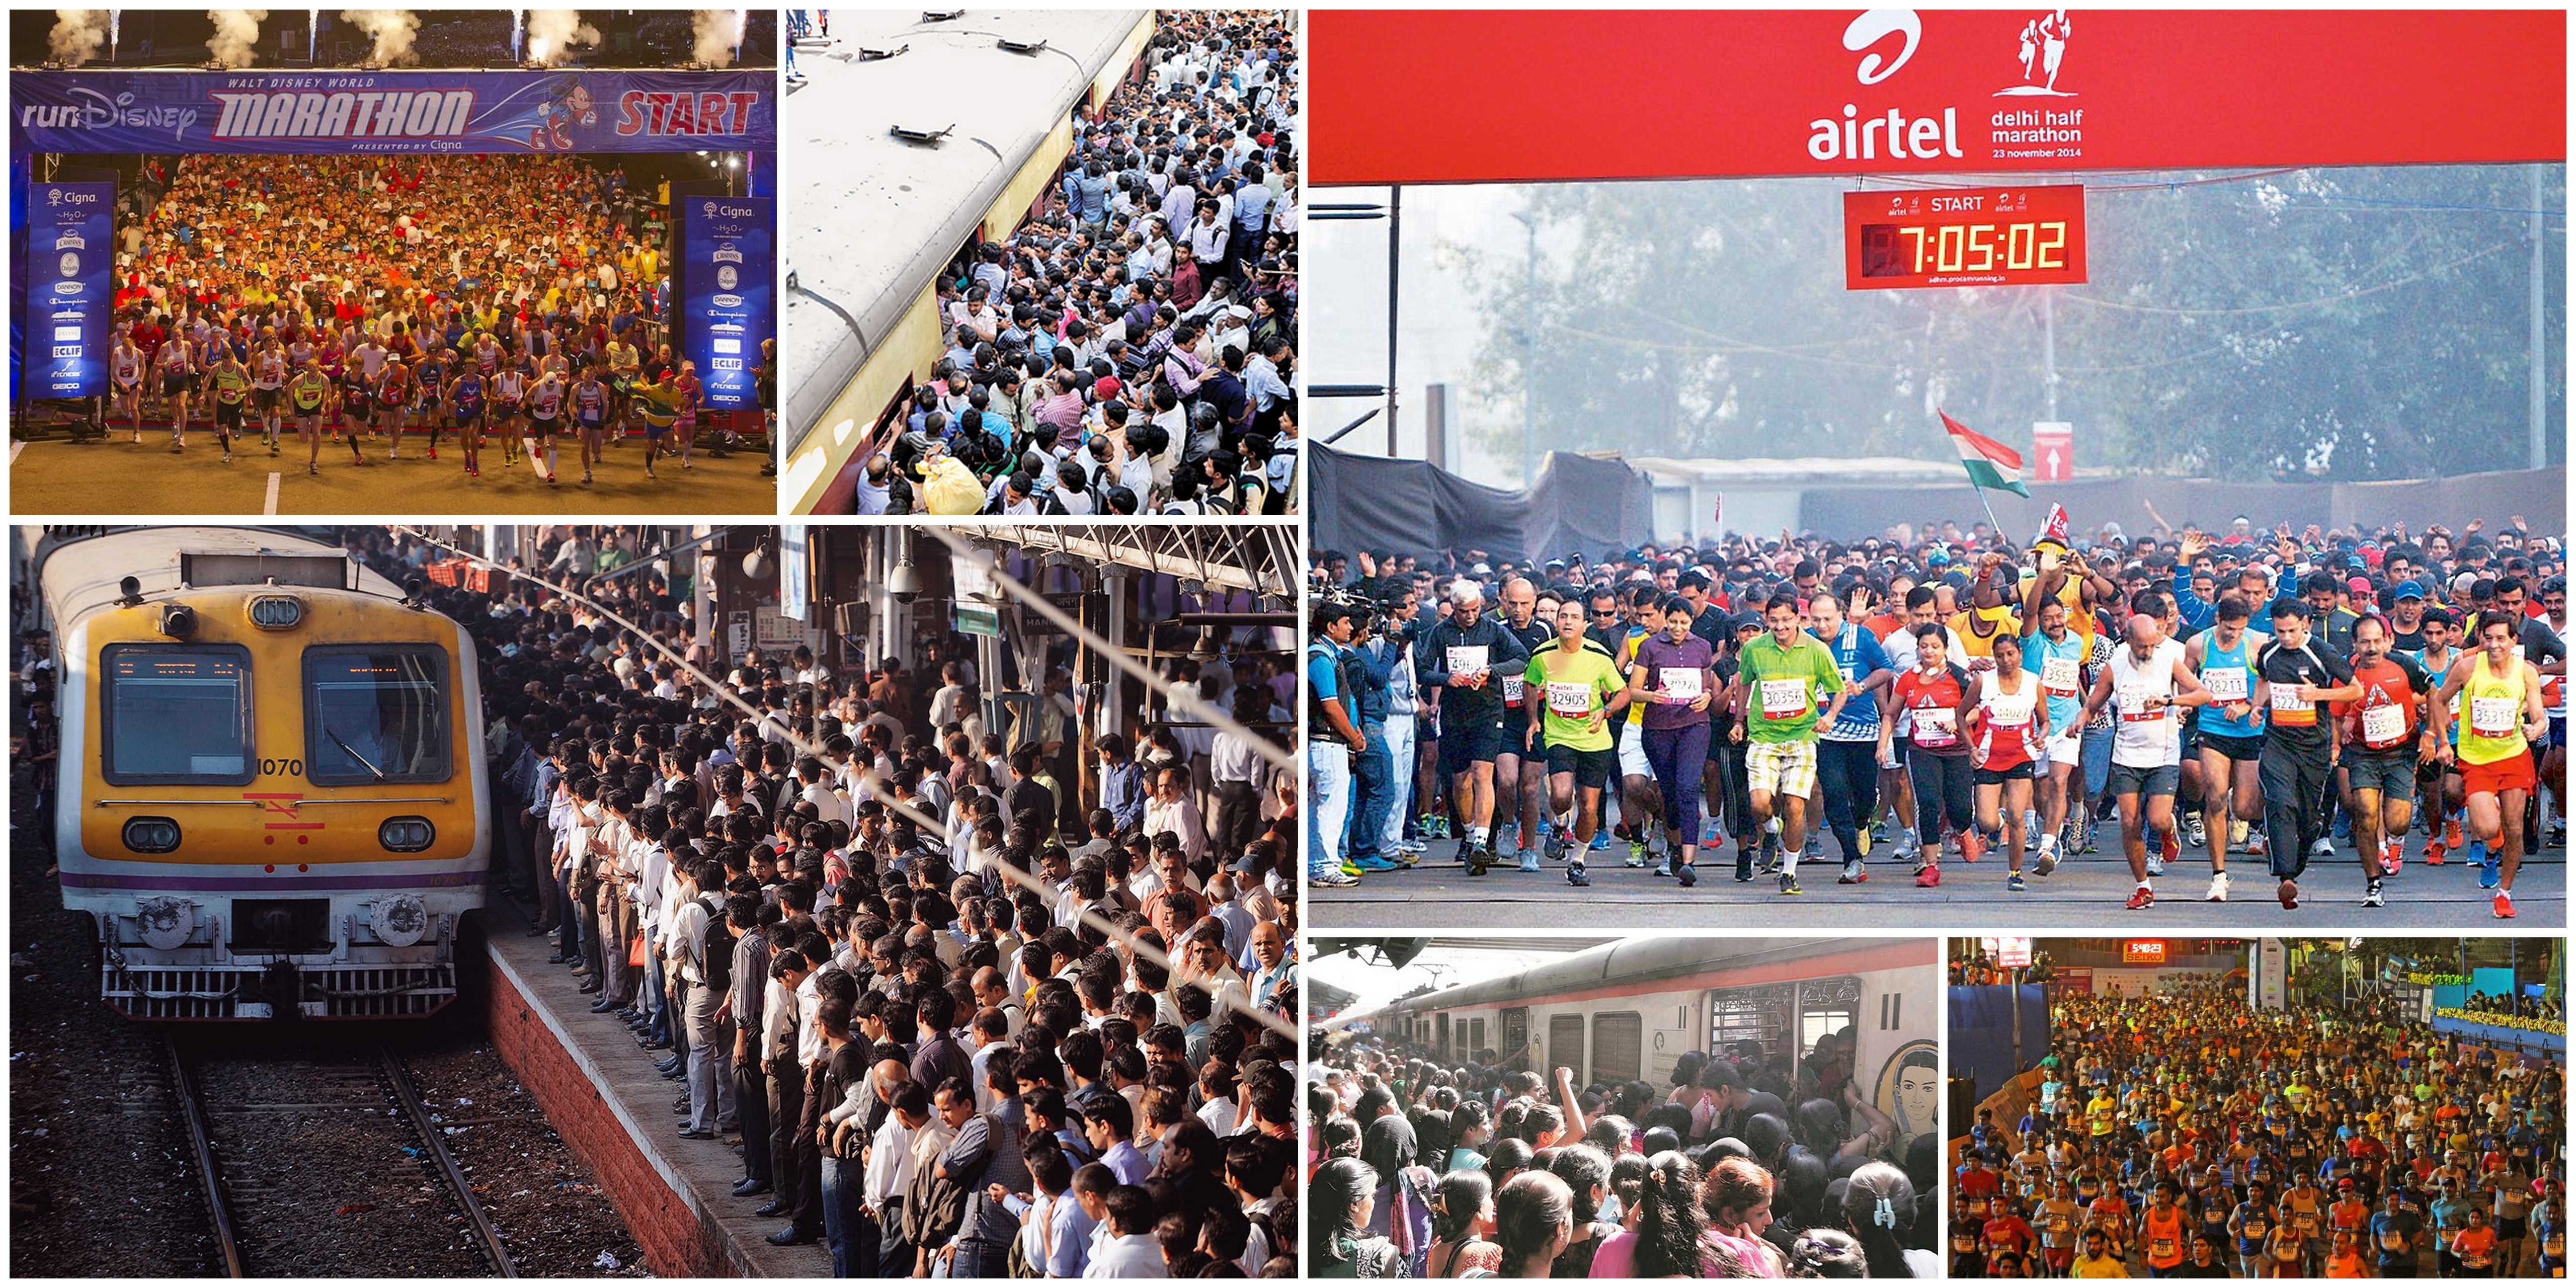
Have you ever run one of the big races in India like the Standard Chartered Mumbai Marathon (SCMM) or the Airtel Delhi Half Marathon (ADHM) and had varying experiences about the ‘flow of crowd of runners’? As the number of racers has grown and the increased focus on logistics for handling them has tried to avoid making a mess and avoid a human catastrophe, I have been curious about the flow of runners at the start and its subsequent impact along the route. Today’s conversation, with some interesting pictures, is about that. Takeaway lessons for you, racer, pacer or race organizer, will come soon.
Roadmap
I will first talk about the distribution of runners and how it transitions from start line to finish line. I then introduce you to my idea of ‘disorder’ in a race, with a measure that I call the Race Entropy, and show how that beautifully captures the flavour of the ease of flow within a race. I use the case of the Mumbai races (SCMM) to show how start-enclosures have helped with achieving less disorder (but significant room for improvement exists). I also show what impact the extreme pollution scares in New Delhi last winter had on the race that was held at that time (ADHM2016).
Gross Time, Net Time, Mat Crossing Time
I have shown you numerous graphs in the past of race finish times. These are typically histograms of ‘net finish times’ that show how many runners cross the finish line within each time bucket, where each bucket might be just a few seconds wide. What you will have probably never seen until today is a similar picture of what happens at the starting line.
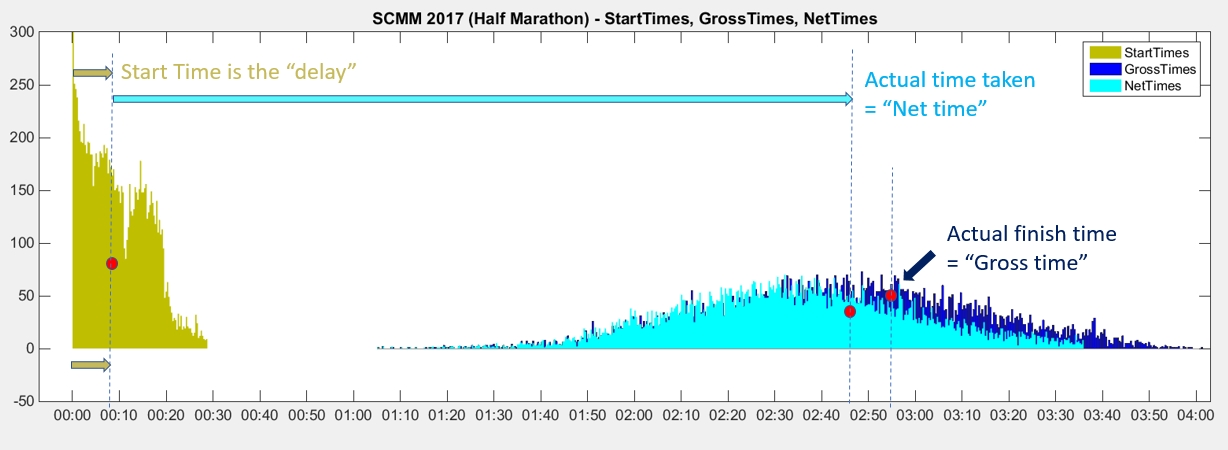
Because not everyone crosses the starting line at the same time, there is a ‘spreading out’ or ‘distribution’ over time of runners crossing the starting line. This distribution is what leads to the need for recording gross finish time and net finish time.
The gross time is based on the natural clock time – the same clock for all the runners.
The net time is the specific time taken for each individual runner measured as, starting at their specific start line crossing (time = 0) and ending at their crossing the finish line.
Many races have RFID timing sensors placed under mats over which runners pass at the start/finish line, and so we often use the terms ‘starting line’ and ‘starting mat’ interchangeably.
Easing Flow
If your race’s logistics are handled smoothly, the fastest runners would be placed right up front at the start line and the slowest runners placed towards the back of the crowd. In the extreme scenario of the runners being released in descending order of their speed, in the hypothetical situation of constant speed for each runner, the number of ‘overtakings’ would be 0. No one would overtake anyone despite everyone running at their race pace. This would ensure a smooth flow of humans across the starting line and thereafter.

In practice, although it ‘feels good’ to overtake other runners, the truth is that it always involves some risk. Besides the physical risk (of impact) if the runner being overtaken sends you negative thoughts as you try to glide past him, that cannot be good for your soul.
Consider now, the worst situation for race start ordering, the slowest runner being placed right up front and the fastest runner at the back of the pack. In the extreme situation of N runners placed in such a reverse order of their speed, the fastest runner would have to overtake N-1 other runners to finish 1st. The runner who comes in second would have to overtake N-2 runners to come in 2nd. And so on for all the other runners… And, therefore, {ignoring the school maths proof}, the total number of ‘overtakings’ for all N runners would be ½*N*(N-1). Let us call that measure MaxPossibleOvertakings – e.g. for 10,000 participants placed in this reverse order MaxPossibleOvertakings will be 49,995,000.

For any given race with an actual ordering at the start line, we can also easily add up the minimum number of ‘overtakings’ that would have led to the actual finish ranking observed. Let us call this MinPossibleOvertakings.
Having defined a measure for the actual starting/finishing rankings of runners and the theoretical measure with maximum disorder, let me now tell you about what I call the ‘Race Entropy’ of an event. If numbers or equations faze you, hang in there, there’s nothing particularly complicated in what follows.
Entropy
Borrowing from Thermodynamics, I define the measure of disorder in a race as being the ratio

If the runners are released in the perfect ranking of their eventual times, so that there will be no overtaking, the Race Entropy will be 0.
If the runners are released in the perfectly reverse order, the Race Entropy will be 1.
If the ordering is purely random chance, the Race Entropy will be approximately ½.
We hope that the Race Entropy for any race will be less than ½ and closer to 0.
Start-End Ranking Plot
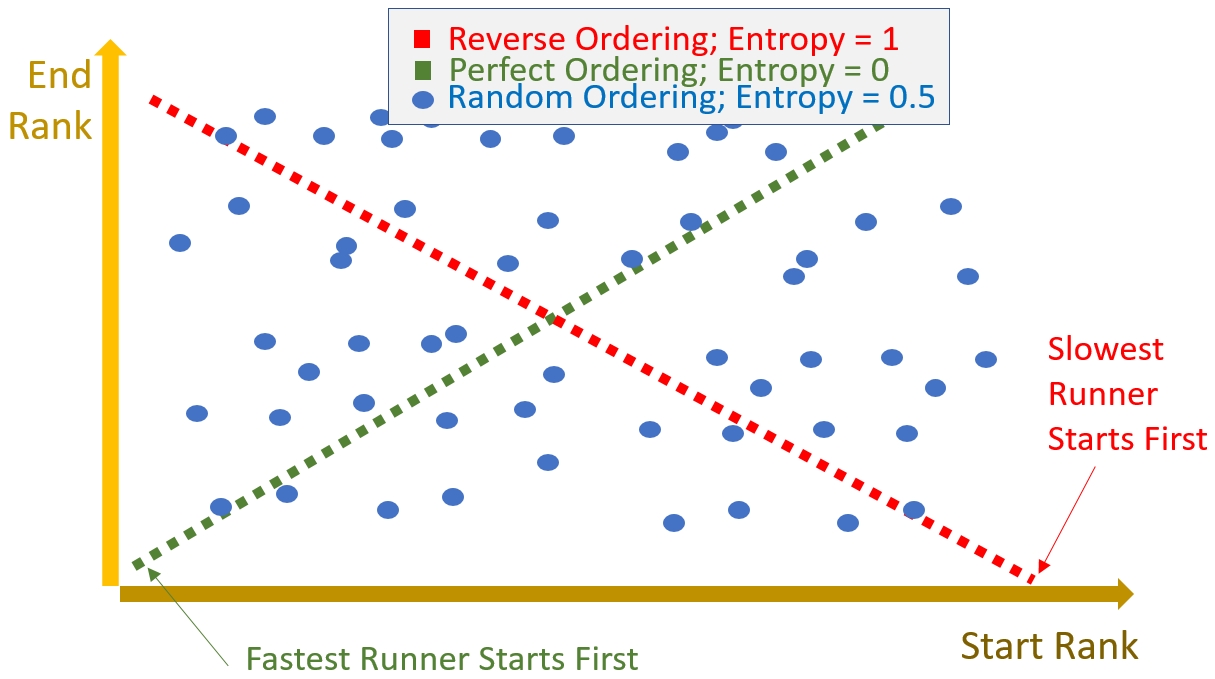
We can also visualize this order and disorder with what I call a Start-End Ranking Plot – a rank for crossing the finish line plotted against the rank for crossing the start line. This example plot shows the two ends of [1] perfect order and [2] perfect disorder as well as [3] the case of purely random start ordering.
With this distilled single measure of disorder, Race Entropy, and the Start-End Ranking Plot, let us now examine a couple of interesting stories from the Indian recreational marathon scene.
Case 1 – Chaos to Order: Introduction of Enclosures for SCMM
The first year that I happened to run a distance race, quite by chance, was the flagship Mumbai Marathon in 2010 (SCMM2010). I remember being at the start line and witnessing the undignified pushing and jostling. It was pretty much ‘law of the jungle’ up there akin to the local trains I took to work daily. It was a free-for-all, first-come-first-serve type start, so everyone pushed up ahead, with no real attention to ordering themselves naturally by expected finish time.
Race Start Enclosures
Race start enclosures or ‘holding areas’ were first introduced to the Indian running scene in January 2012, at the Standard Chartered Mumbai Marathon. These enclosures, now common in the races with large numbers of participants, are set up with the philosophy that the fastest runners are kept together and typically go past the start line first, the slowest ones last, and the ones in-between following the same principle. In order to decide which start-enclosure you wait in before you start the race, race organizers request a recent race timing certificate from you at the time of registration. Based on this ‘previous timing certificate’ you, the customer, are allocated a start enclosure, specified visibly on your racing bib.
Pre/Post Enclosures
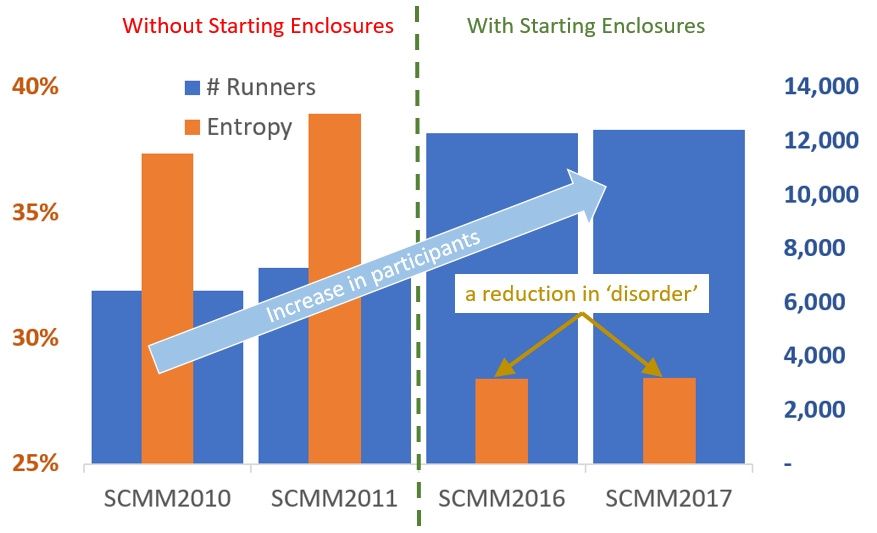
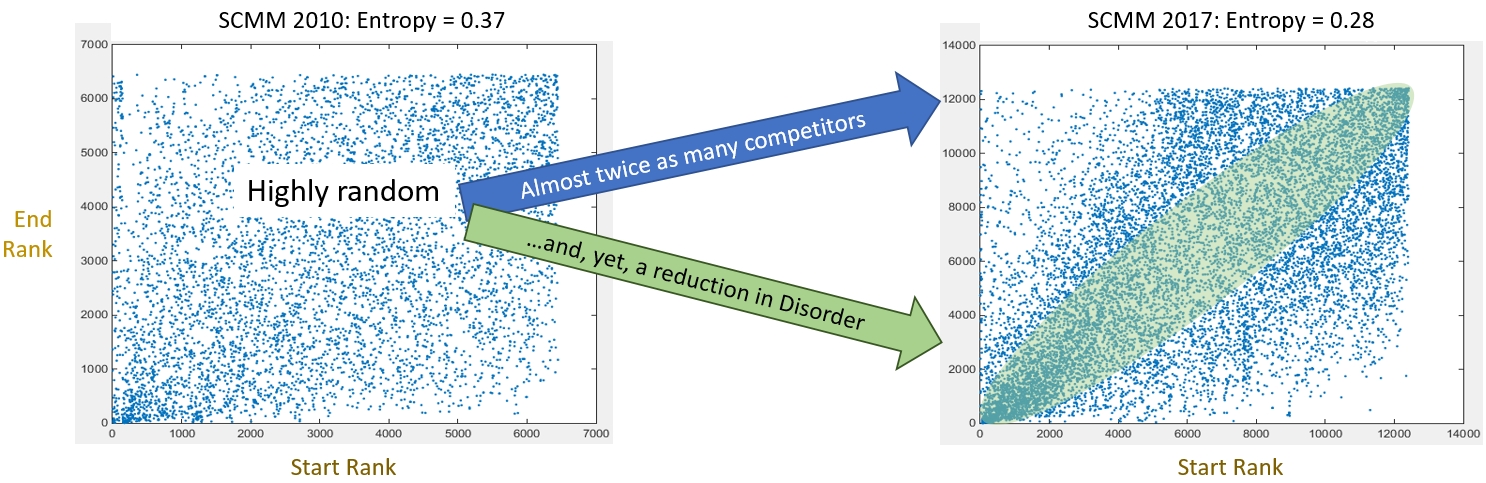
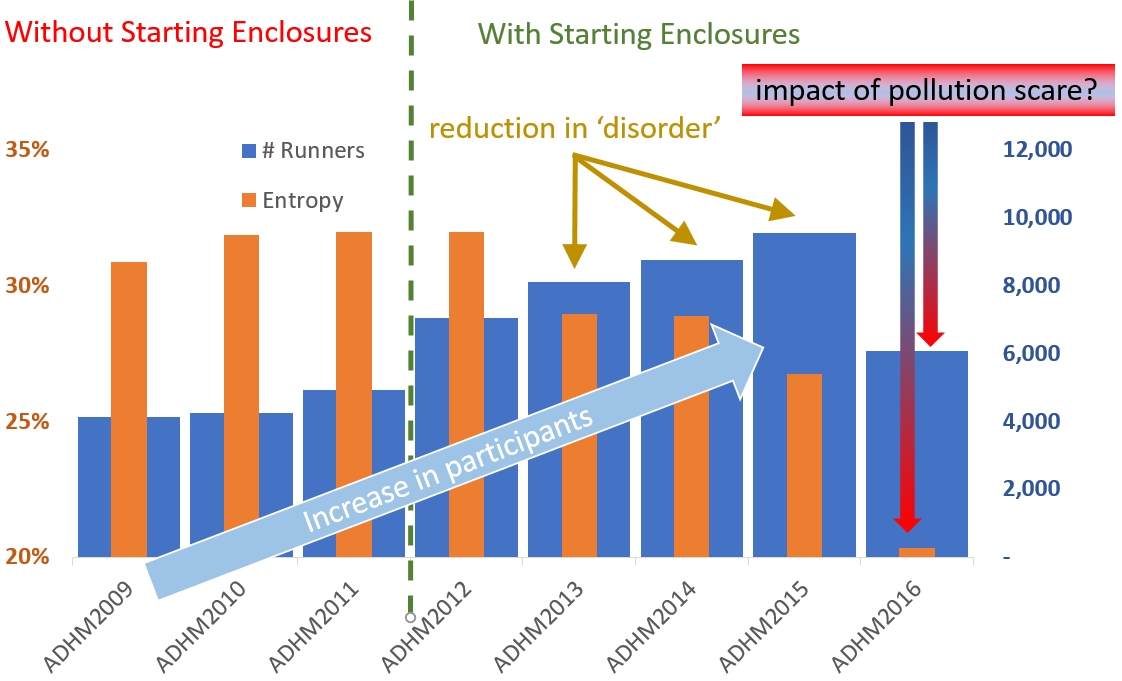
If we examine the difference between 2010 & 2011 compared with 2016 & 2017 there is a noticeable reduction in Race Entropy despite the number of participants rising. Having seen the Race Entropy drop between 2010 to 2017 despite the massive increase in participation, we can see the Start-End Ranking Plot which corresponds to those numbers and the picture tells us the same story.
Comparing the Start-End Ranking Plot for 2010 with that from 2017 indicates a clear move away from high disorder towards greater order.
Case 2 – Pollution Reduces Race Participation: Massive Reduction in Delhi Disorder
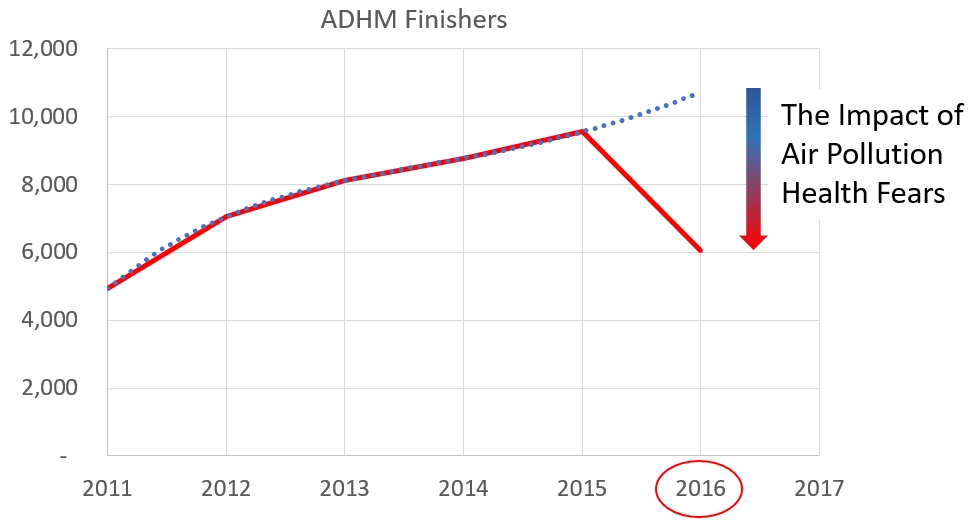
The flagship race of New Delhi, soon after the worldwide scares in the media about the city’s air pollution levels at the end of 2016, saw a massive reduction in actual participation on race day (ADHM2016). My simple but sensible estimation method tells me that 40% of those who had paid and were registered to race did not show up on race day. This is almost always fortunate for the race organizers and those who do show up to run. The race experience is always better for such large races when the turnout is lower {fewer people chasing the same resources including, quite literally, air, water and land}.
What is interesting is that the Race Entropy was so much lower (20.3%) than in 2012 (32.0%) when the ADHM first introduced start enclosures. It was also considerably lower than the previous year where in ADHM2015 the Race Entropy was 26.8%. Perhaps, the general time trend in Race Entropy shows that the running population itself is becoming slightly mature and sensible as a group about the race start. For ADHM2016, it is possible that a predominance of experienced runners showed up and many of the newer runners stayed away. Or, perhaps, managing fewer runners with arrangements for many more (who did not show up) induces lower Race Entropy (lower disorder). All my friends who ran ADHM2016 had a fantastic experience. As luck would have it the weather was (described by a mentee who ran) ‘absolutely perfect’ and my guess is that the reduced disorder added to a better overall experience.
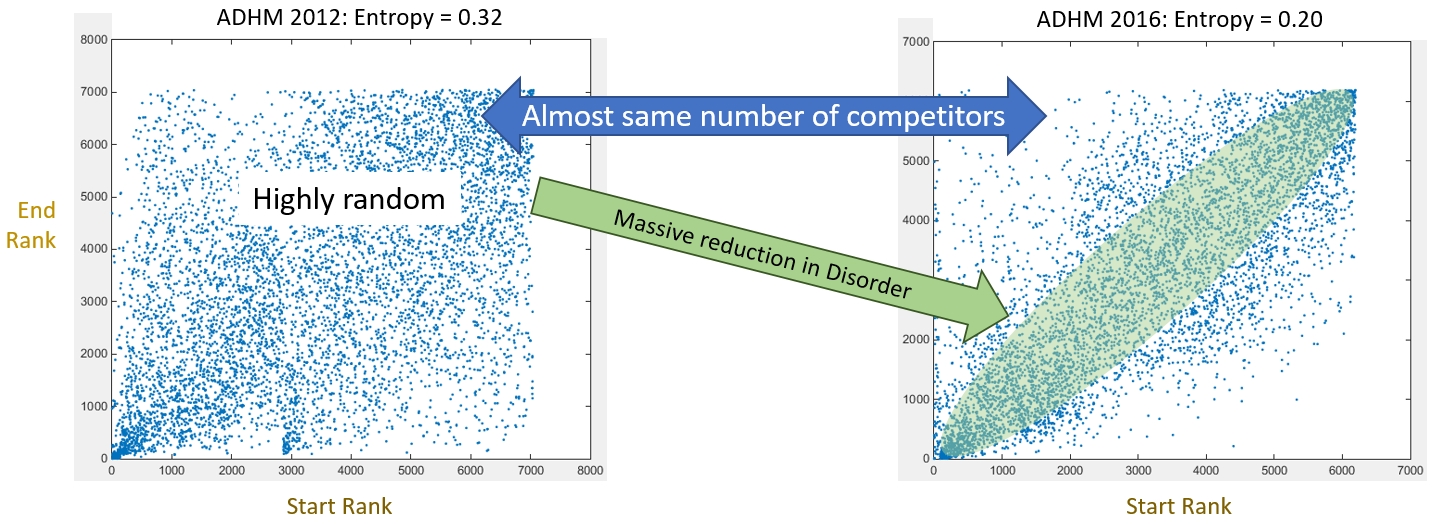
Once again, comparing the Start-End Ranking Plot for 2017 with that from 2012 when the number of participants was similar and start-enclosures had just been introduced indicates a clear move away from high disorder towards greater order.
Summary and Way Forward
I introduced the concept of ‘disorder’ or Race Entropy to characterize the (lack of) ease of flow within a race. I showed how the introduction of start-enclosures based on ‘expected finish time’ helps reduce this Race Entropy (disorder). So, besides features such as aid stations, route marshaling, medal quality, pricing of race entry tickets, and post-race refreshments Race Entropy serves as a superb single measure to capture the overall race experience for those who turned up.
I will write again soon and provide guidance to you the racer, race pacer or race organizer based on this dimension of analysis.
Until then, try to not bump into anyone 🙂

Dr Purnendu Nath spends his waking hours focusing on helping individuals and organizations reach their goals, to make the world a better place. He speaks, writes and advises on topics such as finance, investment management, discipline, education, self-improvement, exercise, nutrition, health and fitness, leadership and parenting.

Nice one Puru! May be you should submit such insights to some sports journal … I can imagine the amount of time and dedication that goes in. Keep writing 🙂
Best wishes,
Sreenath
LikeLiked by 1 person
Thank you for your kind words Sreenath…
About publishing in a journal… besides handing over copyright, it reduces the readership [unless first published freely to the public] and also opens one up to tons of annoying peer review changes that one might not be willing to make (intellectually or from a labour perspective).
Of the many finance research publications I have, the one with the most number of reads is the only unpublished one!!
I really appreciate that you did read this; the articles that I’m most proud of typically end up being the least read {guess why? 😉 }
LikeLike
Puru very analytical and very well explained.
Regards,
Yogesh Kanchgar
LikeLike
Thanks Yogesh!
Yes, it’s one of the pieces that I’m very pleased about…
LikeLike
How painstakingly you do all this all research . It gives various insights to us. Thanks
LikeLike
Excellent piece of analysis and writing. Looking forward more such in future.
LikeLike
In depth research well done
LikeLike
[…] time ago when I spoke to you about chaos within a race and introduced the concept of entropy, the focus was on intra-race chaos. At many events, there is more than one race. And many of those […]
LikeLike