

Do you sometimes wonder for how long you will keep improving your race times? Do you see some friends (appear to) continue to improve year after year, and yet others (seem to) not improve much at all, and some even (seem to) be get slightly worse every year? What could your own benchmark be for athletic performance as the years roll past? Would be good to have a handle on that, right? (Did you wonder why I have those few words in parentheses and emphasized in italics? It is because what ‘appears to’ be, or ‘seems to’ be, might not always be!)
Now, what if you could follow almost 200 recreational distance runners for 7 years over the same race that they ran year-after-year? That might tell you a lot about where your own running might take you, right? Well, here’s some evidence based guidance, based on data never seen before, that I have put together for you.
After listening to what I have to say here, mostly facts, and some conjecture, you will be able to plan your own distance running or other athletic targets for the years to come.
Quick Background
From early childhood to post-puberty, children keep improving for years in various measures of fitness. There is a difference between boys and girls and, depending on what feature of athletic performance one looks at, for a given youth the path will follow periods of rapid improvement, stagnation, and then further improvement followed by tapering off in improvements. What can we say for adult recreational athletes?
Some studies suggest that it takes about 4 years of training for an adult to reach their peak potential. Of course, it is quite likely that the results from controlled studies on adult sporting professionals might not apply to you. That is especially the case if you are an urban recreational athlete. So, let us listen to the story from a unique data set that I have prepared for us.
Unique Data
I look at the case of my ‘home race’, the Standard Chartered Mumbai Marathon, and examine the performance of all the runners who raced the exact same half marathon or full marathon every single year for 7 years in a row (2010 to 2016). This is a small subset of the urban running population. But it is a very valuable subset as it allows us to follow the exact same population of runners over multiple years. Recreational runners in Mumbai face all the constraints and challenges of life in a city with a very high population density, stupidly high real estate costs, terrible public infrastructure and not the most pleasant weather in the world. Having said that, I believe the broad pattern of results will apply to any pairwise population cohort and race combination.
Earlier Work on this Race Event
In a much earlier conversation I presented what happened between 2010 and 2014 to the overall numbers of all participants in the races and average race times over those 5 years. Earlier this year I presented here how that overall quality (race times) and quantity (number of participants) had changed in the period 2010 to 2016. Neither of those investigations had controlled for individual runners being identified and tracked separately across races. Then, when I addressed the question Are Recreational Marathoners in India Getting Faster? I tackled the issue of identifying runners across consecutive races and examining their performance. I identified and tracked 50,719 consecutive period race pairs. However, this repeated pairing was done only across consecutive races – not across the entire span of multiple years. Now, for the first time, here, I identify and examine the same runner across a long span of 7 years and always running the same race – either the half marathon 7 years in a row, or the full marathon 7 years in a row.
Noise
There will be a few cases within the data where the race times are not representative of the ‘true state of athletic performance’. Examples include: transfer of racing bibs to friends who are a lot slower/faster, pacing a slower set of runners, sudden bout of food poisoning during the race. Cramping or running injuries mid-race are not equivalent examples because they do indicate the state of the runner – unprepared for the race!
What happened to Race Times over 7 Years?
There were only 158 participants who ran the half marathon in all 7 years. The equivalent number for the full marathon is just 35, so I exclude them for now but will refer to them shortly.

As the bar graph shows, in terms of the average finish time of the group, the absolute athletic performance does not keep improving each year endlessly. In fact, besides being numerically similar, the average race time sometimes does not prove to be statistically different from one year to the next (i.e. given the variation in individual timings from one race to the next, the average of the race times of all runners in each year does not change enough for that change to be distinguished to be different from zero). So then what can we say about the variation from one year to the next?
Factors Affecting Performance

Of the broad factors affecting performance, the (i) Temperature on race morning and (ii) Humidity on race morning which can, confusingly, often vary in opposite directions to each other can be cleverly combined into the single Heat Index for those race mornings for neater analysis. The process followed by (iii) Ageing is deterministic (a year every year!) even if its effect is not constant, and so can be ignored to a very good first approximation between consecutive years (even if not across a 7-year jump). The (iv) Elevation profile was approximately the same for the years 2010 to 2015 (inclusive) and we can note the effect of the noticeably changed route in 2016. The process followed by (v) Training is the big unknown, and is individual runner specific, and is into which we can subsume all variation unexplained by the other factors when comparing successive years for any individual runner. This includes physical conditioning over a year, psychological training for athletic performance, and any other on-race-day individual behaviour.
Note that although we cannot distinguish between those who commenced running in 2010 and those who might have been active distance runners for 30 years, by aggregating numbers, we can smoothen out individual idiosyncracies and examine the overall impact of Training and the other factors on the entire cohort over that period.

Plotting the Heat Index for each of the race mornings along with the average finish times we can see that, from 2011 to 2016 the Heat Index stays within a narrow band, but the performance does not really improve much with time. The effect of training of these runners over a year is not strong enough to drive race performance to faster finish times.

Worsening Performance in 2016 – Route Change, Ageing or Training?
When the changed route for the Half Marathon was announced for 2016 I spoke to you about the challenges. My estimate then was that it would add between 1%-3% to your race time. Given that the Heat Index was almost identical on the race mornings of 2015 and 2016, one might conclude that (all other things remaining equal) the (2.56%) slower time in 2016 vindicated my forecast estimate of 1%-3%. Of course, the runners were a year older. But, let’s assume that the extra year of ageing didn’t really affect performance. Then, since the Full Marathon had the same route for both 2015 and 2016, perhaps we can say that those who had been running it for 7 years in a row displayed worse performance! The effect of a year of ageing had now overpowered an extra year of training! In that case we cannot separate out the effects of the route change for the Half Marathon and the worsening because of ageing versus training.

Why we should Love this Special Population?
It is instructive to note that this population of runners who had run the same 7 races for 7 years in a row is a unique subset of the 45,000 humans who ran in either the half or the full marathon in those 7 years. They are not representative of the typical recreational runner (who clearly did not run the same race for 7 years). However, they are an especially useful segment of the running population because they tell us what we can reasonably expect of ourselves when we set out to make running (or any other physical activity) a part of our lives for the long run. You can also see that their athletic ability spans a wide range and you will be able to identify your own ability within this range.
What does this Story Really Mean for You?
I have told you why you need not run and even why I don’t care about your podium finish (or mine). I love to include running as one very very tiny part of the many activities I engage in for a happier life. I ran my first half marathon (accidentally) in that same Half Marathon in 2010 but am not part of this data set. However, the numbers speak to me very clearly and form evidence based guidance on what could be appropriate benchmarks for my own running as the years roll by. Even as I write this closing paragraph, I noticed that my regular weekend long-run buddy features in the data. He has a Half Marathon PB of 1-hour-12-minutes (many years ago) and is the fastest runner in this cohort of runners. I like the guidance that these numbers give me. How will you benefit from their story?

Dr Purnendu Nath spends his waking hours focusing on helping individuals and organizations reach their goals, to make the world a better place. He speaks, writes and advises on topics such as finance, investment management, discipline, education, self-improvement, exercise, nutrition, health and fitness, leadership and parenting.

Thanks guru, the article was nice ,as siddhu says, stats are like mini skirt reveal more than they hide..
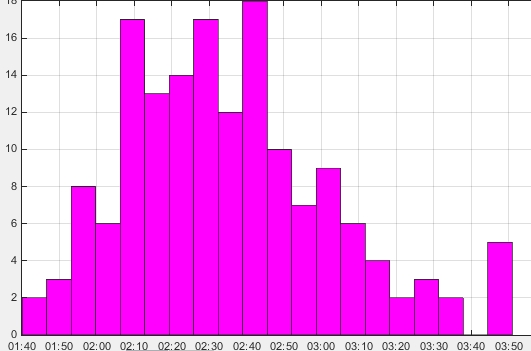
1)the pink graph was difficult to read on the x axis.
2) I am very surprised to see the three hour plus times in the graph over seven years… maybe age group wise distribution reveals more of the reaso
LikeLike
The x-axis is just finish times… The y-axis (vertical axis) is the numbers of runners in each ‘time bin’.
Often stats are like ugly legs inside a mini-skirt… you’d rather they didn’t show what you didn’t want to really see!!
If not prepared correctly, they can lie too, of course 🙂
LikeLike
Thanks guru for the new insight on skirts 🙂 …yes these were the time bins…I am in awe how you do all those runner correlations…
LikeLike
Yes, both of us are not part of this data set!
LikeLiked by 1 person
Great Analysis.
LikeLike
Very well researched findings ! Kudos to your style and application , Sir !
LikeLike
Guess I am your average runner. The HM statistics hold true for me, to a large extent. Over the years, post quite a few running injuries, I’ve realized moderation is what works best for me. I run about thrice a week because I truly enjoy running but as far as PBs are concerned, I love them but can’t afford them. 🙂
LikeLike
Dear Yasmin
Thank you for reading the article and your comments. If you guessed that you are part of the special population, you had guessed correctly!
Your wisdom from experience is much required by the running population and it’s great that you shared it.
The follow-on article centered around ‘So, you will get slower, so what?’ will emerge from my computer one day soon…
Cheers!
Puru
LikeLike
[…] To get a better picture of what has been happening with aggregate numbers, you can also see my much earlier report on what happened between 2010-2014. And for the most sophisticated analysis on Indian marathon running so far you may want to look at the question “Are Recreational Marathoners in India getting Faster?” and its follow-on multi-year cohort analysis in “You are getting slower sooner than you think“. […]
LikeLike
[…] Whenever we have an outcome that is better or worse than what we hoped for, we can explain the difference between what we expected and what transpired with some obvious factors. And, often some of the difference remains unaccounted for given the information we possess. [I did something along those lines at a population level when I made this assertion.] […]
LikeLike
[…] To get a better picture of what has been happening with aggregate numbers, you can also see my much earlier report on what happened between 2010-2014. And for the most sophisticated analysis on Indian marathon running so far you may want to look at the question “Are Recreational Marathoners in India getting Faster?” and its follow-on multi-year cohort analysis in “You are getting slower sooner than you think“. […]
LikeLike
[…] Recreational Marathoners in India getting Faster?” In an even more robust analysis, here, I demonstrated that “You Might Run Slower Sooner Than You Think” after attempting to […]
LikeLike
[…] hedge fund manager, as a finance researcher, as a website designer, as a competitive athlete, as a sports scientist, as a polyglot, for pollution research, for medical diagnosis and wellness, and even for marathon […]
LikeLike
[…] hedge fund manager, as a finance researcher, as a website designer, as a competitive athlete, as a sports scientist, as a polyglot, for pollution research, for medical diagnosis and wellness, and even for marathon […]
LikeLike
[…] had already told you, 3 years ago, that you might run slower sooner than you think. The most valuable observation that we can make from the additional data since then is that this […]
LikeLike
[…] [Read: Why you might run slower sooner than you think] […]
LikeLike